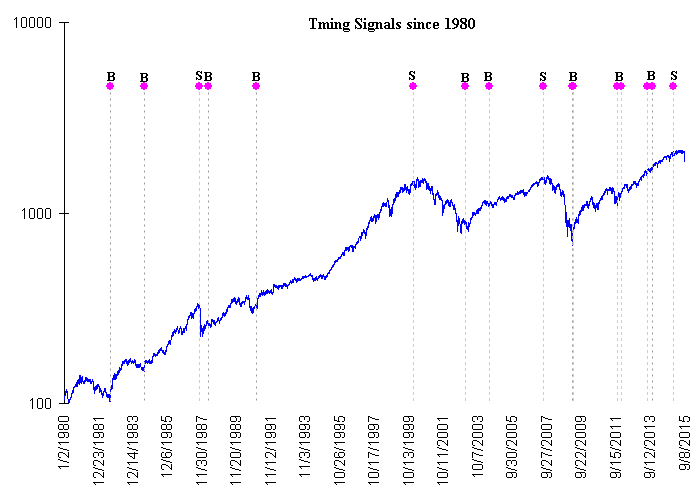
401K/TSP Timing Signals
(Updated 12/1/15) This page gives all of the Buy and Sell
Signals using our Market Timing System which focuses on the S&P 500.
We use our Mutual Fund Panic Index along with Breadth Thrusts to time Buy Signals and then use a
combination of Hussman and Hindenburg Omen Signals to time Sell Signals. For those that are government employees and use the
Thrift Savings Plan (TSP) these signals pertain to the C Fund. We
advise that when there isn't a Buy Signal to have your money in the G Fund for
people who are using the TSP.
The Long Term Primary Buy and Sell Signals are based on being fully
invested in a Fund that tracks the S&P 500. For Government Employees
the C Fund tracks the S&P 500.
| Buy
Signal |
Entry |
Exit |
Sell Signal |
% |
| Date |
Price |
Price |
Date |
Gain/Loss |
| Aug-82 |
119.51 |
321.83 |
Sep-87 |
169.3 |
| Aug-84 |
166.68 |
321.83 |
Sep-87 |
93.1 |
| Mar-88 |
258.89 |
1469.25 |
Dec-99 |
467.5 |
| Dec-90 |
330.22 |
1469.25 |
Dec-99 |
344.9 |
| Dec-02 |
879.82 |
1455.27 |
Jul-07 |
65.4 |
| May-04 |
1120.68 |
1455.27 |
Jul-07 |
29.9 |
| Mar-09 |
797.87 |
1606.28 |
Jun-13 |
101.3 |
| Oct-11 |
1253.3 |
2058.9 |
Jun-13 |
64.3 |
| Oct-13 |
1756.54 |
2058.9 |
Dec-14 |
17.2 |
|

