|
(1/30/18)
The VIX has risen just above its longer term downward trend line. In the
past, each time the VIX has rallied back to its downward trend line, it has
reversed back to the downside (points A to B) which allowed the S&P 500 to make
a new all time high (points C to D). So the question is will the pattern
repeat itself again or will the VIX actually continue higher this time around?
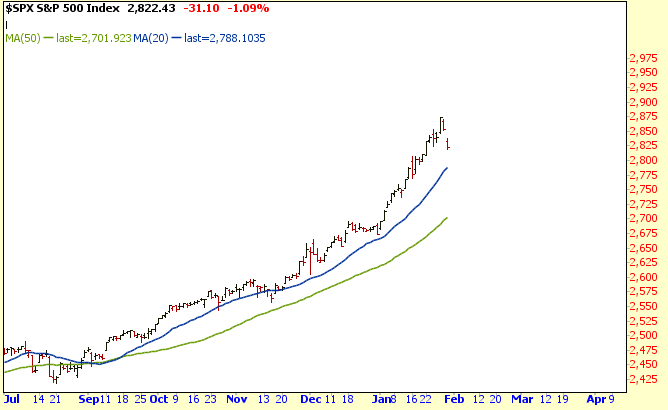
If the VIX were to continue higher the first level of support in the S&P 500 is
around 2790. This area is along the 20 Day Moving Average (blue line).
| MFPI |
Market
Advance/Decline |
Market
Breadth
2:1 Ratio |
Cash
Flow |
| Signal |
Signal |
Signal |
Signal |
| No |
No |
No |
No |
Amateur Investors
|

