
Weekend Analysis
(9/6/03)
The Market
The S&P 500 was able to break out of its trading range and above the key 1015 level early in the week however it had a difficult time following through and came under some selling pressure on Friday. The S&P 500 needs to hold support near the top of its prior 12 week trading range near the 1015 level to remain constructive in the near term if it remains under some selling pressure early next week. If it doesn't hold support near the 1015 level then the S&P 500 could drop back to its rising 20 Day EMA (blue line) which is currently around the 1005 area.
From a longer term perspective I still think the S&P 500 has a fairly decent chance to rise up to the 1065 level which is where a major longer term resistance area exists that coincides with its 200 Weekly EMA (blue line) and 38.2% Retracement Level calculated from the early 2000 high to the October 2002 low.
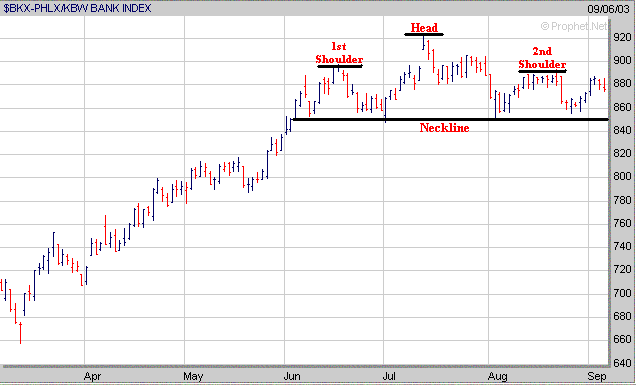
One of the key sectors that has a lot of weight in the S&P 500 is the Banking sector (BKX). The BKX is still exhibiting a potential Head and Shoulders Top pattern. However if the BKX can rally above its 2nd Shoulder near 890 then this may allow for it to rise back to the 925 area which would allow for the S&P 500 to rise up to the 1065 level mentioned above. On the flip side if the BKX breaks below its Neckline near the 850 level then that would spell trouble for the S&P 500.
The Dow encountered some selling pressure by the end of the week as well and the key short term support area to watch is at its 20 Day EMA (blue line) near 9400. If the Dow fails to hold support at its 20 Day EMA then the next area of support is at its 50 Day EMA (green line) near 9250.
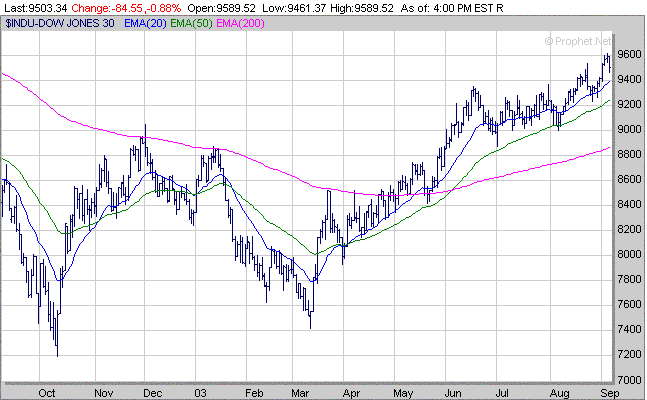
As for the longer term the Dow still has the potential to rise up to the 10000 level which is a longer term resistance area associated with its 61.8% Retracement Level calculated from the early 2000 high to the October 2002 low.
The Nasdaq which has been acting the best of late has gotten a little ahead of itself as it has rallied over 200 points since early August and is probably due for some type of pullback. As you can see since mid March the Nasdaq has gone through a series of rallies (points A to B, C to D, E to F, G to H and I to J) followed by some type of pullback (points B to C, D to E, F to G and H to I) before reestablishing its upward trend. If we do see a pullback develop in the Nasdaq it could drop back to its rising 20 Day EMA (blue line) which is currently just above the 1780 level.
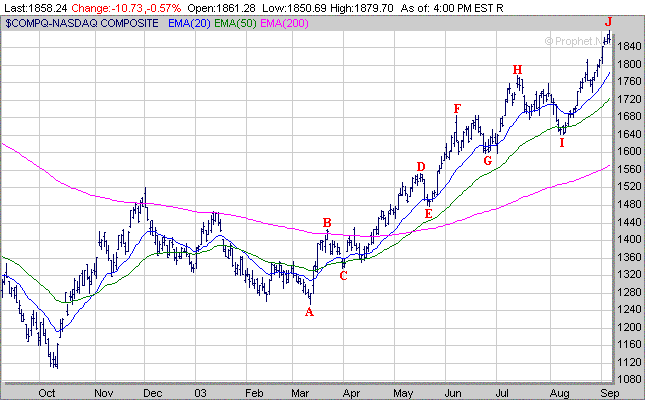
From a longer term perspective the Nasdaq is approaching its 200 Weekly EMA (blue line) which is just above the 1900 level so if it does continue higher before pulling back it may encounter resistance at this level. If the Nasdaq is able to rise above its 200 Weekly EMA then next area of upside resistance would be at its 23.6% Retracement level near 2050 (calculated from the early 2000 high to the October 2002 low).
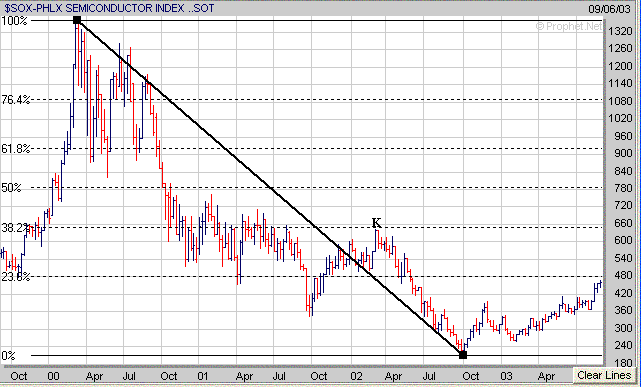
Meanwhile since the Nasdaq is dominated by stocks which are technology related it's always important to keep track of what the Semiconductor sector (SOX) is doing. Right now the SOX is approaching a longer term resistance area near the 480 level which is the 23.6% Retracement Level calculated from the early 2000 high to the October 2002 low. If the SOX breaks above the 23.6% Retracement Level near 480 the next area of upside resistance at its 38.2% Retracement Level near 650 which also coincides with the high made in 2002 (point K).
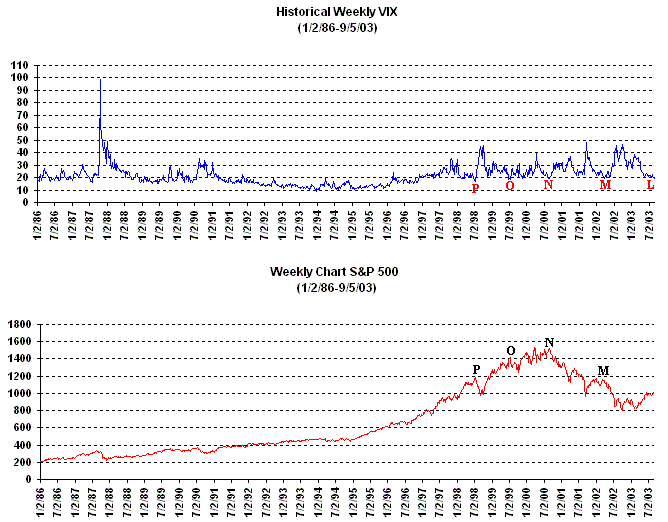
As far as the Contrarian Indicators the Volatility Index (VIX) remains at a very low level which has been the case for several weeks now (point L). At least since 1997 when the VIX has been at a very low level (generally below 20) this has usually been a precursor to some type of sustained sell off (points M, N, O and P).
However as the historical chart of the VIX shows below there was a period from 1992 through 1995 when the VIX remained generally in a range between 10 and 20. Also notice that during much of this period the S&P 500 basically traded sideways from 1992 through 1994 before starting a steady up trend beginning in 1995. The question is could we see a similar situation develop over the next several months with the VIX remaining below 20 while the market generally trades sideways similar to what occurred from 1992 to 1994?
Stocks to Watch
(All charts are weekly unless denoted otherwise)
One reason why you should always have a Stop Loss Order in place is that you never know when a company might release some negative news. HILL which broke out strongly on Tuesday after developing a 7 week Handle came out with some negative news on Friday regarding future sales and quickly reversed strongly to the downside. Thus even in a favorable market environment stocks can still get sold off if something negative comes out.
Since many stocks broke out this past week there are now a limited number which are still setting up as compared to the past few weeks.
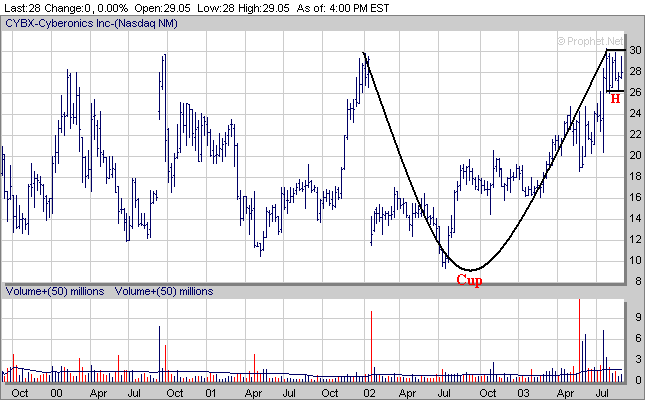
CYBX has developed a 5 week Handle (H) after forming a 1 1/2 year Cup. Its Pivot Point is near $30.25.
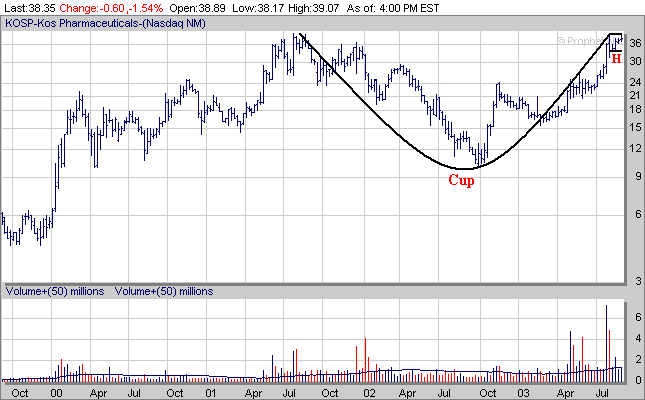
KOSP has developed a 4 week Handle (H) after forming a 2 year Cup. Its Pivot Point is near $40.
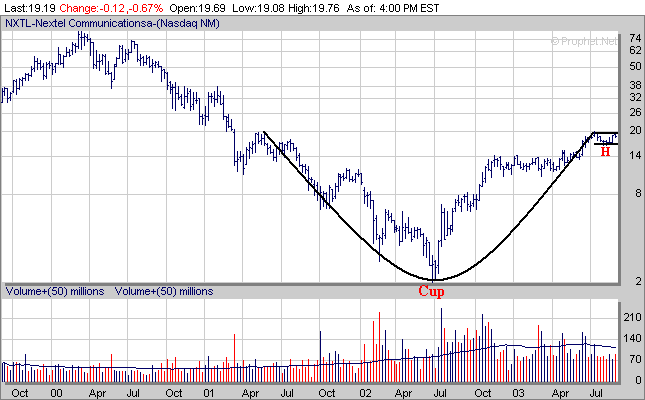
NXTL has developed a 7 week Handle (H) after forming a 2 year Cup. Its Pivot Point is near $20.50.
TTG has developed a 4 week Handle (H) after forming a 16 month Cup. Its Pivot Point is around $5.
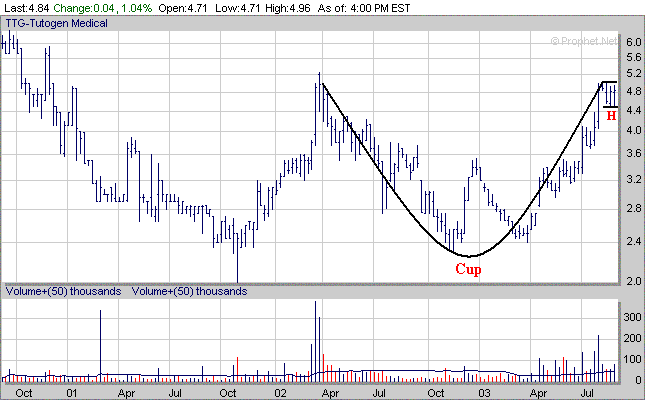
Although several stocks did breakout this week many of them didn't develop much of a Handle before doing so that is a bit worrisome. Also if we start seeing more stocks like HILL implode that could be a cause for concern as well. As mentioned in the market analysis the Nasdaq has risen over 200 points since early August and is due for a pullback so we could see some selling pressure redevelop in the near term. Thus make sure to have Stop Loss Orders in place on any currently held positions.
| Stock Deleted from AII Top 100 |
Stocks Added to AII Top 100 |
Stocks dropped from AII Portfolio |
Stocks Added to AII Portfolio |
Earnings
Reports AII Portfolio |
| None | None | HILL | None | None |