|
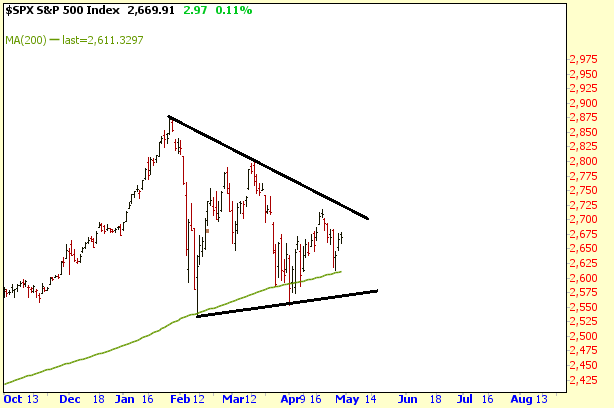
The S&P 500 once again has held support near its 200 Day Moving Average (green
line) for the 3rd time since February. One of these days the 200 Day MA
won't hold which will be followed by a decent drop.

Meanwhile the S&P 500 is still exhibiting a possible Triangle consolidation
pattern. The upper part of the Triangle is around 2725 while the lower
portion is near 2575. If a Triangle pattern is forming then a significant
upside or downside move is going to follow eventually.
If this move were to occur to the upside the 3000 level, in the S&P 500, would
be a potential target. Notice this is the 261.8% Extension Level
calculated from the 2007 high to the 2009 low.
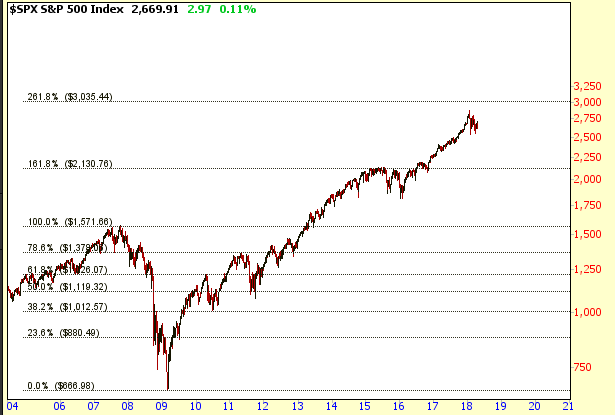
Meanwhile if the S&P 500 breaks to the downside instead a potential target would
be around 2350. This level corresponds to the 23.6% Retrace, calculated
from the 2009 low to the most recent high, and is aligned with the upward trend
line connecting the 2011 and 2016 lows using a log scale.
Amateur Investors
|

