|
Weekend Analysis
(6/24/06)
The Market
Next week we have a
Federal Reserve meeting and also it will be the end of the 2nd Quarter so I
expect we will see an increase in daily volatility starting next Wednesday which
will continue through Friday.
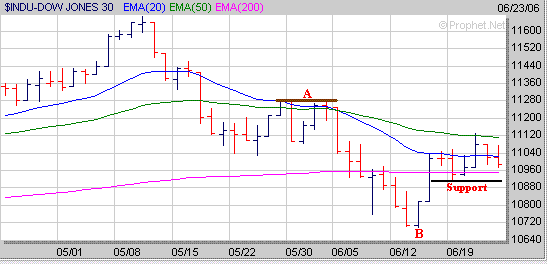
In the near term the Dow has encountered resistance at its 50 Day EMA (green
line) near 11120 but has found support around the 10900 area. Next week I
expect we will see one of two things happen. The first scenario would be
for the Dow to rise above its 50 Day EMA near 11120 leading to an upward move
back to around 11275 (point A) which is where it stalled out at in late May and
earlier this month. Meanwhile the second scenario would be for the Dow to
break below the 10900 level leading to a retest of the low made just a few weeks
ago near 10700 (point B).
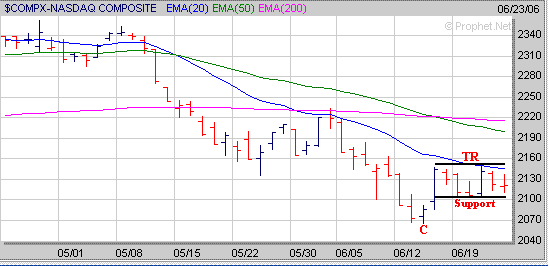
The Nasdaq has been in a short term trading range (TR) after the big move upward
seven trading days ago and has encountered resistance at its 20 day EMA (blue line)
near 2145 while finding support just above the 2100 level. Next week I
would look for one of two things to occur. If the Nasdaq can rise above
the 2145 level then it may quickly rally back to either its 50 Day EMA (green
line) near 2200 or its 200 Day EMA (purple line) just below the 2220
level. Meanwhile if the Nasdaq breaks below the 2100 level the look for it
to retest the low made a few weeks ago near 2065 (point C).
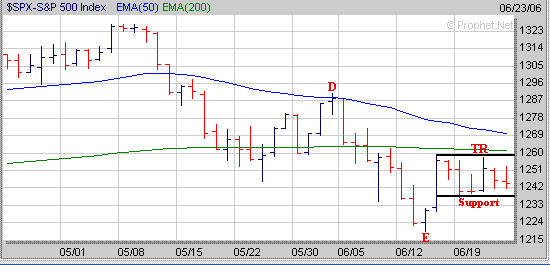
 As for the S&P 500 it has
developed a short term trading range (TR) as well after the big move upward just
over a week ago. In the near term so far the S&P 500 has encountered resistance just
below its 200 day EMA (green line) near 1260 but has been finding support around
1237. I imagine the S&P 500 will break out of this
short term trading range at some point next week and do one of two things.
If the S&P 500 can rise above the 1260 level then look for it to either move
up to its 50 Day EMA (blue line) near 1270 or possibly as high as the 1290 area
which is where it stalled out at in late May (point D). Meanwhile if
the S&P 500 breaks below the 1237 level then look for it to retest its low
made a few weeks ago near the 1220 area (point E).
 Although the market hasn't been
acting well since early May there are some encouraging developments that may
eventually bode well for the longer term. The latest sentiment data
involving the % of Bearish and Bullish Investment Advisors now shows that there
is an equal number of Bearish and Bullish Investment Advisors as the % difference has
dropped to zero (point F). If the % of Bearish Investment Advisors
continues to rise and the % of Bullish Investment Advisors continues to fall
then this could eventually signal a nearing market bottom. As we have seen
in the past when the % of Bearish Investment Advisors has outnumbered the % of
Bullish Investment Advisors by around 10% (points G) this has led to a market
bottom (points H) followed by a substantial rally.
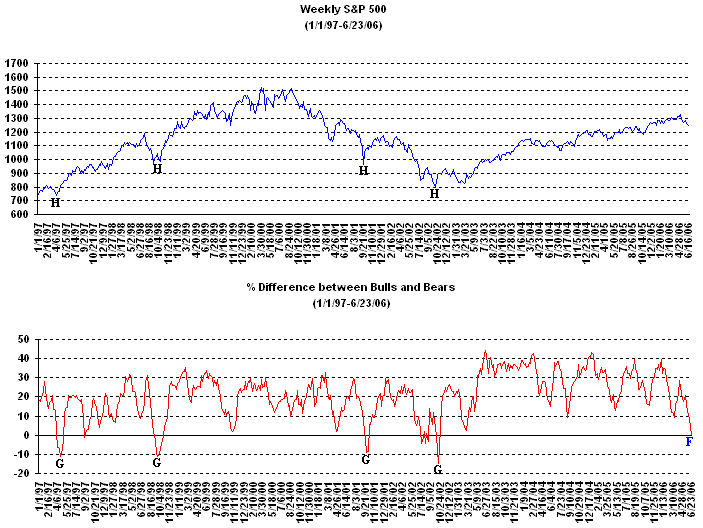
Thus hopefully we will continue to see more Investment Advisors become Bearish
about the longer term prospects of the market which would give us a pretty
reliable signal of a nearing bottom.
Stocks to Watch
(All charts are weekly unless denoted otherwise)
With the Federal
Reserve meeting next week and the end of the 2nd Quarter I expect we are going
to see a strong move occur next week in one direction or the other.
However at this point it's not clear which direction that move may be. If
the market likes what the Federal Reserve says then look for a strong move
upward however if the market doesn't then look for the exact opposite to happen. If
a decent move upward does occur next week then this could give us some limited
opportunities in some of the stocks mentioned below. ADS
has developed a 9 week Flat Base with its Pivot Point at $57. 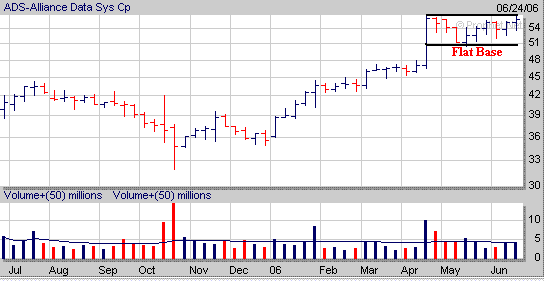
FAL has developed a 6 week Flat
Base (FB) with its Pivot Point at $51.35. 
FUR has developed a 7 week Flat
Base (FB) with its Pivot Point at $6.30. 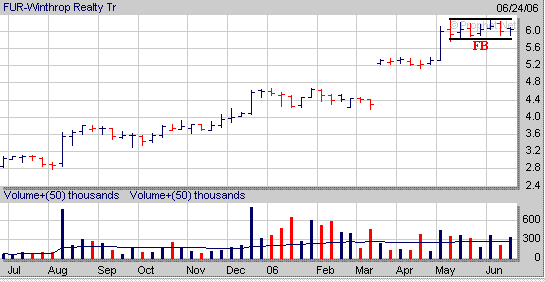
LTXX has developed a 5 week Handle
(H) with its Pivot Point at $8.05 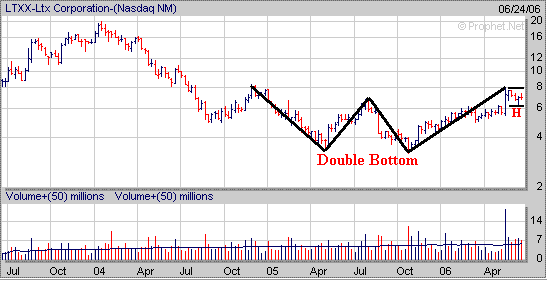
PNFP has developed a 9 week Flat
Base (FB) with its Pivot Point at $30. 
SMDI has developed an 8 week Flat
Base (FB) with its Pivot Point at $13.25. 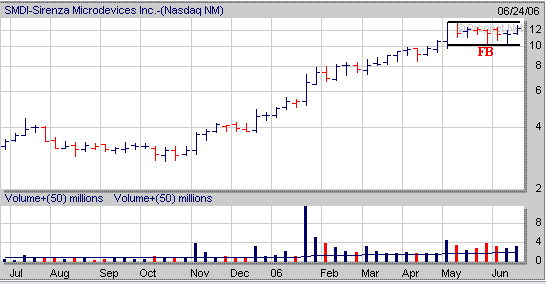
If you decide to take a position in
any of these stocks make sure they reach their Pivot Points first. Also I
would keep the size of any new position on the small side as well.
The guidance for our Long Term and Short Term Strategies are
shown below. Also for those that have a limited amount of money to invest
and can only buy a few stocks the table below ranks the above stocks using the
Amateur Investor Index (AII) which includes several parameters such as Earnings
Strength, Relative Strength, Industry Group Strength,
Accumulation/Distribution and etc. Thus if you can only buy a few stocks
focus on the ones with the highest AAI Value in the tables below.
Long Term Strategy
| Symbol |
AII |
Sector/ |
Chart |
Pivot |
Stop
Loss |
5% Above |
Average |
Initial |
| Value |
RS Strength |
Pattern |
Point |
Pivot Point |
Daily |
Target |
|
|
|
(Buy Price) |
|
Volume |
Price |
| FAL |
|
Mining |
6
Week |
$51.35 |
$48.50 |
No |
276,000 |
$56 |
| 57 |
Misc
Ores |
Flat
Base |
|
87 |
|
| FUR |
|
Financial |
7
Week |
$6.30 |
$5.75 |
No |
53,000 |
$8 |
| 54 |
Equity
Reit |
Flat
Base |
|
54 |
|
| SMDI |
|
Electrical |
8
Week |
$13.25 |
$12.25 |
No |
524,000 |
$17 |
| 48 |
Semiconductor
Equip |
Flat
Base |
|
52 |
|
| ADS |
|
Financial |
9
Week |
$57.00 |
$54.00 |
No |
900,000 |
$62 |
| 46 |
Misc
Services |
Flat
Base |
|
58 |
|
| PNFP |
|
Banks |
9
Week |
$30.00 |
$28.00 |
No |
47,000 |
$34 |
| 46 |
Southeast |
Flat
Base |
|
69 |
|
| LTXX |
|
Electrical |
Double
Bottom |
$8.05 |
$7.25 |
No |
1,100,000 |
$11 |
| 33 |
Semiconductor
Equip |
with
a |
|
52 |
5
Week Handle |
Short Term Strategy
| Symbol |
AII |
Sector/ |
Chart |
Pivot |
Stop
Loss |
5% Above |
Average |
Initial |
| Value |
RS Strength |
Pattern |
Point |
Pivot Point |
Daily |
Target |
|
|
|
(Buy Price) |
|
Volume |
Price |
| FAL |
|
Mining |
6
Week |
$51.35 |
$50.35 |
No |
276,000 |
$52.35 |
| 57 |
Misc
Ores |
Flat
Base |
|
87 |
|
| FUR |
|
Financial |
7
Week |
$6.30 |
$5.75 |
No |
53,000 |
$7.30 |
| 54 |
Equity
Reit |
Flat
Base |
|
54 |
|
| SMDI |
|
Electrical |
8
Week |
$13.25 |
$12.25 |
No |
524,000 |
$14.25 |
| 48 |
Semiconductor
Equip |
Flat
Base |
|
52 |
|
| ADS |
|
Financial |
9
Week |
$57.00 |
$56.00 |
No |
900,000 |
$58 |
| 46 |
Misc
Services |
Flat
Base |
|
58 |
|
| PNFP |
|
Banks |
9
Week |
$30.00 |
$29.00 |
No |
47,000 |
$31 |
| 46 |
Southeast |
Flat
Base |
|
69 |
|
| LTXX |
|
Electrical |
Double
Bottom |
$8.05 |
$7.25 |
No |
1,100,000 |
$9.05 |
| 33 |
Semiconductor
Equip |
with
a |
|
52 |
5
Week Handle |
| Stock Deleted
from AII Top 100 |
Stocks Added to
AII Top 100 |
| CAMT, ECLG, PSEM,
STEL, TACT |
FCBP, FMD, HLF,
MEK, OMNI |
Amateur Investors
|


