|
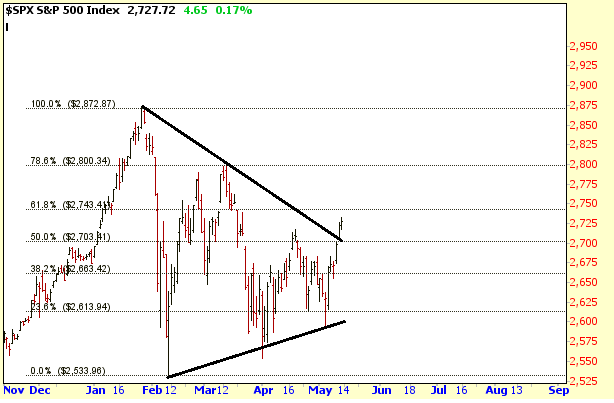
The S&P 500 is attempting to break out of its Triangle pattern to the upside.
It's approaching the first area of upside resistance around 2743 which is at the
61.8% Retrace.
Meanwhile, despite the S&P 500 trying to break out to the upside, one potential
pattern to lookout for is a Gartley pattern. This would potentially trap
the longs who recently bought the breakout. An example of a bearish
Gartley pattern is shown below and once it completes a decent reversal follows.
Looking at the chart of the S&P 500 the recent rally would be the "CD" leg with
a target area around 2775. Thus if a Gartley pattern is forming then the
CD leg would probably complete next week or the week after.
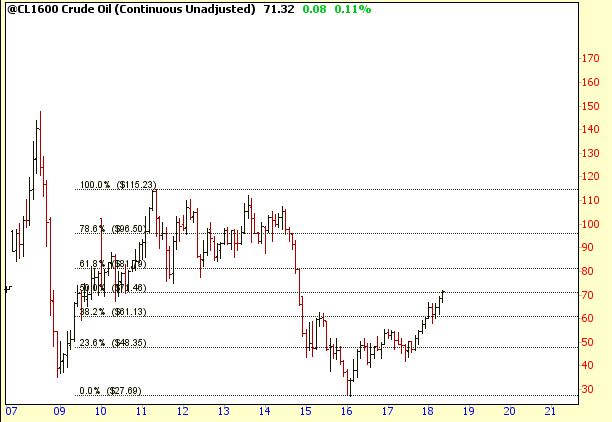
Finally for those watching the price of Oil it has rallied back to its 50%
Retrace calculated from the 2011 high to the 2016 low which is in the lower
70's. At this point it could easily do one of two things based on what
happens in the Middle East. If the situation calms down it could easily
drop back to the lower 60's, however, if things continue to worsen then a rise
into the lower 80's may occur which is at the 61.8% Retrace.
Amateur Investors
|

