Should You Invest in a Stock with Overhead Resistance?
Although many investors are told not to buy a stock which has a substantial amount of overhead resistance this can be misleading at times. Let us look at an example of a stock which did very well in 2002.
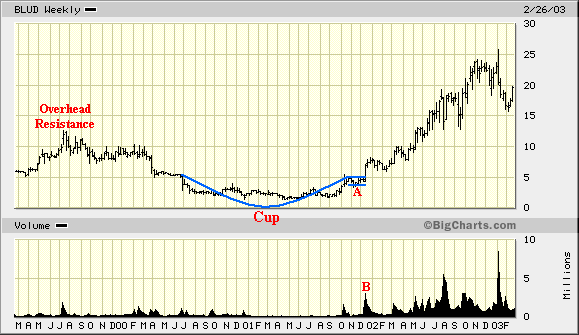
BLUD which had some overhead resistance around the $12.50 level formed a low level Cup and Handle (point A) pattern in 2001 and then broke out in the early part of 2002 accompanied by increasing volume (point B).

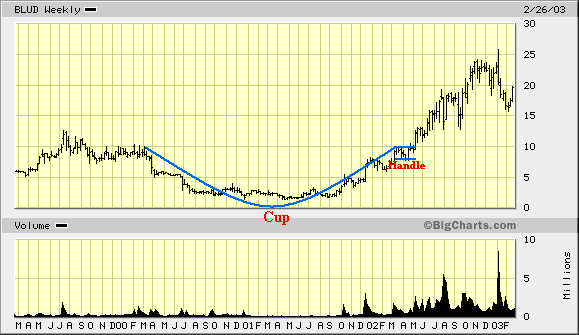
After breaking out in the early part of 2002 BLUD then rose from $5 to $10 a share before stalling out in March. BLUD then preceded to form another longer term Cup and Handle pattern before breaking out again in May of 2002.

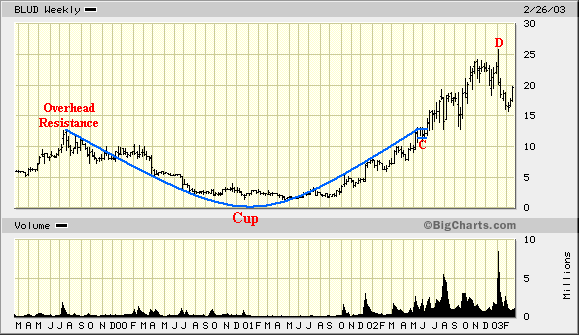
Over the next few weeks BLUD rose from $8 to $12.50 before stalling out again which was near its longer term overhead resistance area. Meanwhile after stalling out near its longer term overhead resistance area BLUD then developed another longer term Cup and Handle (point C) pattern prior to break out for a third time in June of 2002 accompanied by good volume. After breaking out in June BLUD eventually rose to around the $25 level by the end of the year (point D).

As the charts show above investors were given three separate opportunities to invest in BLUD during 2002. Those investors that noticed the first Cup and Handle pattern during the latter half of 2001 into the early part of 2002 were well rewarded as they could have realized a net gain of nearly 400% ($5 to $25) versus those investors who waited for BLUD to break above its longer term overhead resistance area near the $12.50 level. However even those investors who waited for BLUD to clear its longer term resistance still could have potentially doubled their money ($12.50 to $25). Thus even though a stock may have some longer term overhead resistance that doesn't mean it should be ignored especially if it is developing a favorable chart pattern such as a "Cup and Handle".