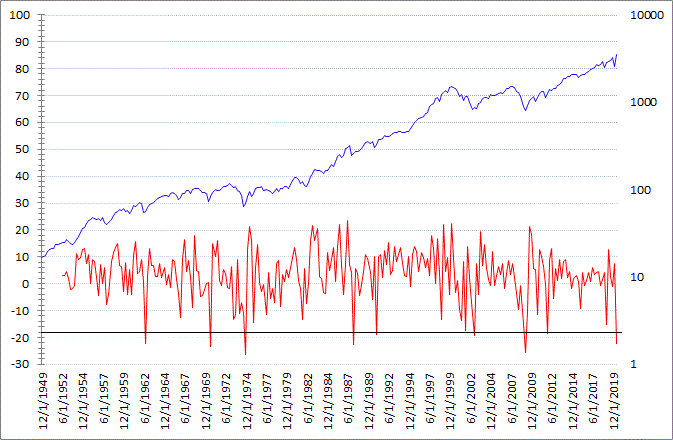
The Mutual Fund Panic Index

Updated 8/30/2020

Based on data reported by the Federal Reserve Flow of Funds Reports, which have been released on a Quarterly basis since 1952.  I have formulated an Index based on flows involving Mutual Funds which I call the Mutual Fund Panic Index.

Basically what the Mutual Fund Panic Index shows is that when the total value of Equities held by Mutual Funds decreases by 18% (black line) on a Quarterly basis significant Market Bottoms have occurred since the early 1950's as the chart below shows. 

Mutual Fund Panic Index
(1952-Present) 

Meanwhile the table below shows all of the Quarterly Signal dates since 1952 along with the total gain in the S&P 500 6 to 12 months later. 


Signal Date % Above Low Sell Off Low Closing Price 6 Months 6 Month 1 Year 1 Year
    End of Month Later Return Later Return
Jun-20 41.4 2192.00 3100.00 ? ? ? ?
Dec-11 17.0 1074.77 1257.30 1362.16 8.3 1426.19 13.4
Mar-09 19.7 666.79 797.87 1057.80 32.6 1169.43 46.6
Dec-02 14.5 768.58 879.82 974.50 10.8 1111.92 26.4
Dec-90 12.1 294.51 330.22 371.16 12.4 417.09 26.3
Mar-88 19.2 216.46 258.07 271.91 5.4 294.87 14.3
Dec-74 12.5 60.96 68.56 95.19 38.8 90.19 31.5
Sep-70 19.3 70.69 84.30 100.31 19.0 98.34 16.7
Sep-62 9.6 51.35 56.27 66.57 18.3 71.70 27.4