Contrarian Indicators are very important when it comes to timing moves in the market. Although it's virtually impossible to time exactly when the markets are going to change direction, by looking at a few indicators it may give you some warning signs that some type of market reversal is near. For 401k investment ideas there are several indicators you can look at however I tend to focus on the Put to Call Ratio, the Bullish-Bearish Sentiment and the Volatility Index (VIX).
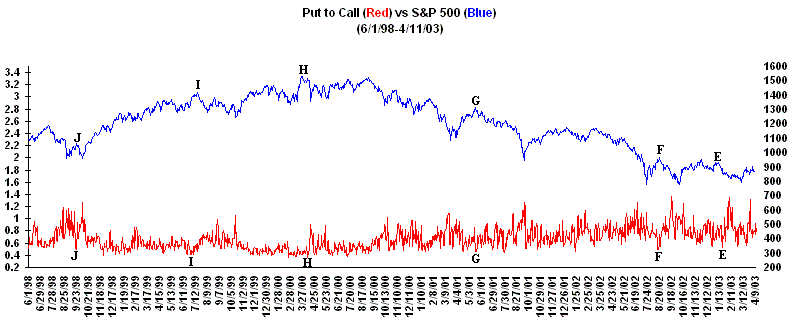
The Put to Call ratio measures the amount of volume in Puts versus Calls. When Put volume becomes excessive in relation to Call volume, it's an indication of excessive bearishness in the market (a bullish sign). Conversely if Call volume becomes excessive to Put volume, it's a sign of excessive bullishness in the market (a bearish sign). A chart of the Put to Call Ratio versus the S&P 500 is shown below.
Notice when the Put to Call Ratio has risen significantly above
"1.0" this has generally led to a market bottom followed by a
significant upside reversal. Some examples include the Fall of 2001 (point
A), Spring of 2001 (point B), Fall of 1999 (point C) and back in the Fall of
1998 (point D). However more recently the Put to Call Ratio hasn't
worked as well as their have been some false signals in which the Put to Call
Ratio rose well above "1.0" but wasn't accompanied by a strong upside
reversal (points E, F and G). Thus this shows its not a perfect
indicator sometimes.
In addition to signaling a potential short term bottom in the markets the Put to Call Ratio may also signal an impending market top as
well especially when it rapidly drops to around ".40" or below.
Some examples include early in 2003 (point E), Summer of 2002 (point F), Spring
of 2001 (point G), Spring of 2000 (point H), Summer of 1999 (point I) and in the
Fall of 1998 (point J).

Thus using this indicator as part of your investing strategy can help determine when the markets may be in for a reversal and help with your trading decisions as even the strongest performing stocks may get hit pretty hard if a market correction takes place. The next indicator we will look at is the Bullish-Bearish Sentiment.
|


