Weekend Analysis
(4/1/00)
The Markets
As mentioned last weekend the Contrarian Indicators still showed that more selling was possible in the markets especially in the Nasdaq. I'm not going to be convinced that the Nasdaq has made a bottom until the Put to Call Ratio approaches around 1.0 and the Bullish-Bearish Indicator shows a capitulation by the Bulls. Always remember an excess of Bullishness is a sign of an impending market top and an excess of Bearishness can begin to signal a market bottom. When the two converge like we saw last October then I will be convinced that a market bottom is near. I would be real cautious with any type of rally in the Nasdaq as it appears that a Double Top has formed. If the Nasdaq can't hold support at its 50 Day Exponential Moving Average (EMA) there is a big drop off to its next support level around 3700 (200 Day EMA). Thus it's going to be critical the next few weeks for the Nasdaq to remain near its current levels. However it may take another big sell off in the Nasdaq to cause widespread panic on Wall Street and get rid of all of the excess Bullishness which still appears to exist based on the recent Contrarian Indicators.
Meanwhile the Dow has made a definite Double Bottom (W shape) and looks similar to the pattern we saw last September and October. Also note the Double Top pattern that occurred in early January and the big sell off that ensued shortly thereafter. Thus don't rule out the possibility that the Nasdaq could suffer the same fate by testing its 200 Day EMA as well.
AII Top 50 Analysis
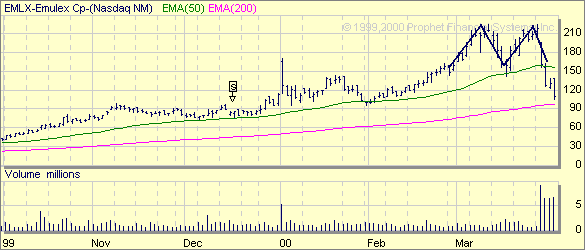
Quite a few stocks have gotten clobbered recently including some of the best performers over the past year such as DIGL, EMLX and TQNT. However other companies like BRCD and SDLI have held up pretty well during the sell off in the Nasdaq. In fact BRCD made a new 52 Week High on Friday. Always key on moving averages and see how a stock reacts when they touch their 50 Day EMA. The chart of BRCD shows how it bounced right off its 50 Day EMA and then looked like it would make a Double Top on low volume. However on Thursday and Friday BRCD rallied on good volume and made a new 52 Week High yesterday. In fact it looks like BRCD still wants to go even higher in the short term.

Now compare the chart of EMLX which did the exact opposite of BRCD. EMLX bounced off its 50 Day EMA as well however after making a Double Top it then sold off sharply on huge volume and broke right through its 50 Day EMA and now looks poised to test its 200 Day EMA. In five trading days EMLX went from $225 to a an intraday low of $104 on Friday.

Another company that was a strong performer last week was AVRT which has been steadily climbing since the first of the year. AVRT broke out of a ragged looking Flat Base in mid-March (point A) on good volume and has been moving upward very steadily. One has to wonder why this stock is performing so strongly despite the current market conditions and if some big announcement is forthcoming.
Meanwhile with Institutional Money flowing out of the technology stocks recently the question is where is this money going? I commented about a month ago that several companies in the Oil Service sector were beginning to attract some interest as the Group Strength numbers were starting to improve. A chart of the Oil Service Index shows that this Index broke out of a Cup and Handle pattern in early March and has continued to perform well. Thus some of that Institutional Money is flowing into this sector.
There are several companies to watch in this group and include APA, BELW, DVN, PENG, POG and VPI. All of these companies have shown strong sales and earnings growth the past few quarters along with rising profit margins. Although some of these companies have already broken out of basing patterns APA and BELW still look interesting. APA has formed a big Cup and now needs to develop a Handle in the short term. BELW has already formed a Cup and Handle pattern and just needs to breakout of the Handle on big volume like we saw in late February.
As I said other stocks like DVN and VPI also look interesting as they have already broken out of Cup and Handle patterns..
Due to the big sell off in the Nasdaq last week some companies
really got whacked and had to be dropped from the AII Top List. These
included ADTN, DIGL, EMLX, HLIT, JMED and TQNT. Some of these companies
have had remarkable runs during the past year and I guess the Institutions
decided to cash in on their profits. These companies were replaced by APA,
DVN, LEH, MVSN, POG and VPI.
To be successful in the markets you have to adjust to changes in the overall
market environment and learn how to follow the Institutional Money. Stocks
that performed well the past several months may become laggards in the upcoming
months as the Institutions invest their money into different
sectors.
The Earnings season will really pickup in April so pay close attention to how your stocks are reacting up to their earnings report. Next week CAMP is supposed to report and based on the performance of its stock price recently it may not be good news. Also WHT is supposed to report on April 3rd. Several other companies in the AII Top 50 will report in mid to late April.
amateur-investor.net