Over the past few years many investors have given up on the
market especially when another round of selling has occurred. However this
is exactly the wrong time to give up on the market because when the market
reverses to the upside those stocks which had been acting well during the sell
off may become the next big winners.
Here are a few examples of what I'm talking about. Let us
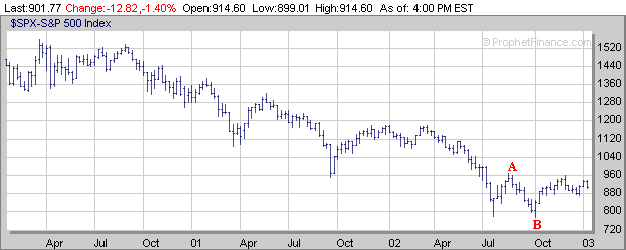
compare the charts of HITK and USNA with the chart of the S&P 500 this past
Summer and Fall when the market was selling off.
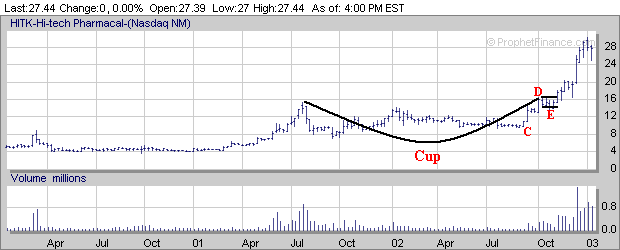
Looking at HITK first shows that this past Summer and Fall while
the S&P 500 was dropping (points A to B) HITK was actually rising (points C
to D) while completing the right side of a 1 1/2 year Cup. HITK then
traded sideways for 4 weeks while developing a Handle (point E) and then broke
out in late October. After breaking out HITK nearly doubled in price over
the next few months before topping out in early January.


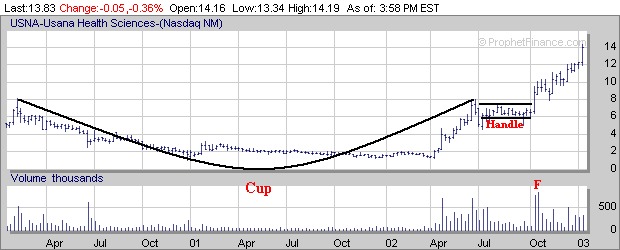
Now let us compare USNA with the S&P 500. USNA formed
a 2 1/2 year Cup from the early part of 2000 until June of 2002. When the
S&P 500 began to sell off last Summer and Fall USNA basically traded
sideways during that period of time while developing a 4 month Handle from July
through September. Then when the market made a bottom in early October and
began to rally USNA broke out of its Handle on huge volume (point F).
After breaking out in early October USNA then doubled in price over the next
three months.

As you can see noticing which stocks are acting well when the
market is selling off can give you a clue to whom the next leaders will be when
the market begins to reverse strongly to the upside.
Signup today for a
"Free" Two Week Trial Membership and see which Stocks are currently
forming favorable Chart Patterns
Other
Helpful Investing Articles


