|
(2/28/09) The market had another bad week as all three
major averages are now exhibiting their final 5th Wave down in association with
a longer term Elliott 5 wave pattern that began in October of 2007.
A classic looking Elliott 5 Wave pattern is shown below. Keep in
mind once the 5th Wave down ends this should be followed by a substantial
"ABC" type corrective rally that may last several months. 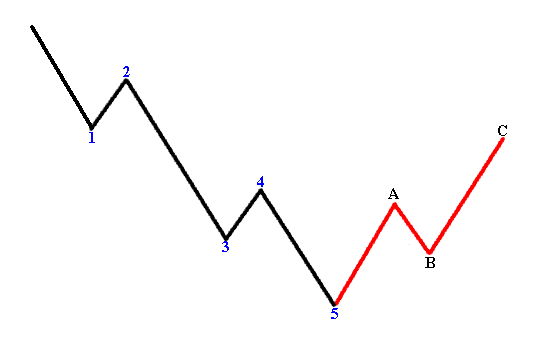 In the chart below I have labeled
all of the sub Waves and major Waves for the Dow. Also notice the
Nasdaq and S&P 500 are exhibiting similar patterns as well. 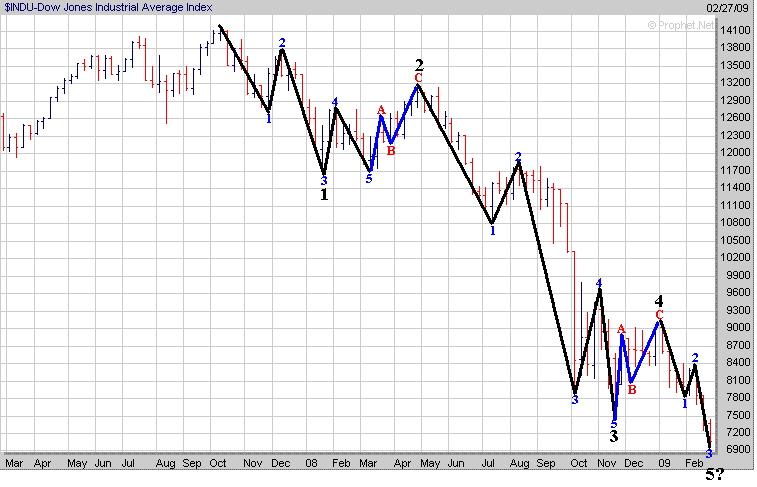
Nasdaq 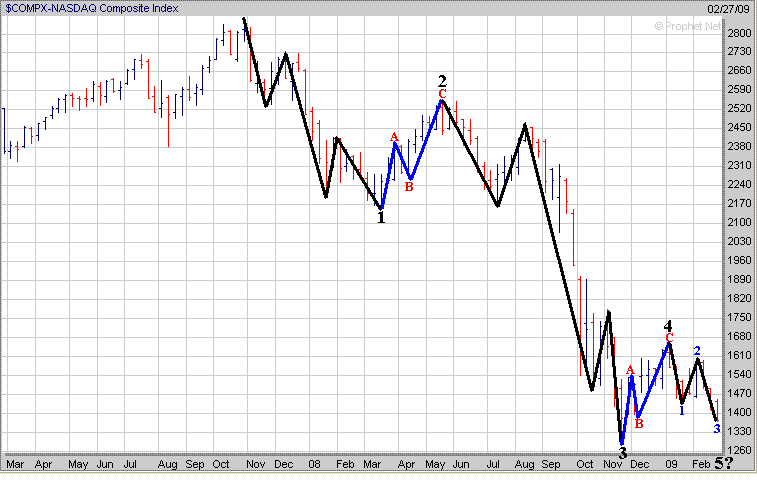
S&P 500 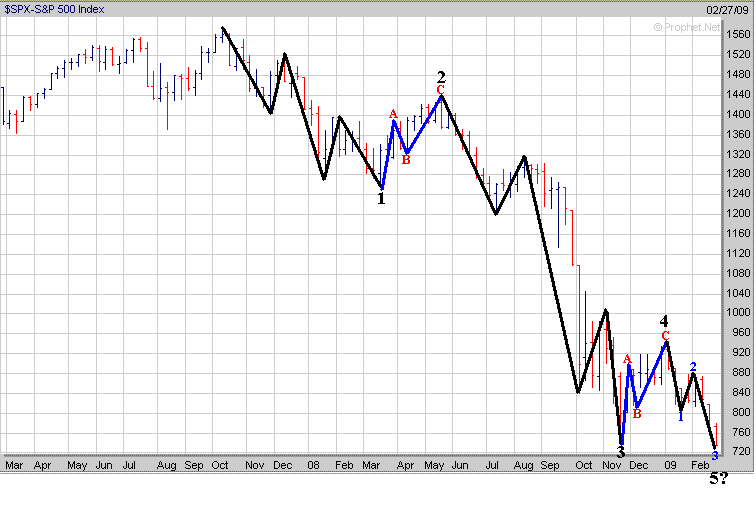
At this point I know many investors
are wondering when a bottom may occur. As mentioned above it does appear
we are seeing the final 5th Wave down so that is a positive sign.
However it's nearly impossible to know when the exact bottom will
occur. According to Elliott Wave Theory the 5th Wave should have 5
sub waves to it with "3" Waves down and "2" Waves
up. If we take a closer look at the S&P 500 on a daily chart it
appears we are in the 3rd sub wave down at this time which eventually should be
followed by a 4th sub wave up and then the final 5th sub wave
down. 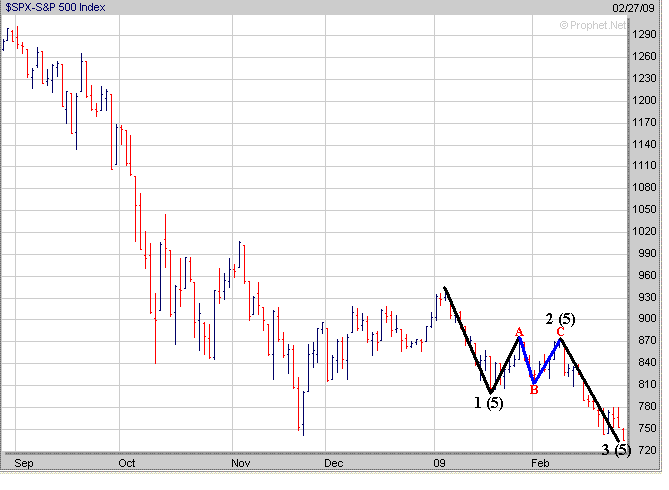
Finally one thing to keep an eye on
in the weeks ahead is the 5 Day Average of the Put to Call Ratio. So far
since the October 2007 top it has done a good of signaling the completion of
major Waves. Notice when the 5 day Average of the Put to Call Ratio
has risen above the 1.15 level (purple line) that this was followed by the
completion of Waves 1 and 3 Down. Meanwhile when the 5 Day Average
of the Put to Call Ratio dropped below the 0.85 level (green line) this was
followed by the eventual completion of Waves 2 and 4 Up shortly
thereafter. Now what is a little bit mystifying
to me at this point is that the latest drop in the S&P 500 hasn't generated
any fear among the Options crowd as the 5 Day Average of the Put to Call Ratio
has actually been falling (points A to B) and is getting close to the 0.85 level
again. Thus you really have to wonder what it's going to take to get
investors fearful of this market to allow for a bottom to occur. At
this time it appears the Options crowd believes the market is getting near a
bottom so that is why they have been loading up on Calls of
late. Thus we shall see if they are right or not over the next
few weeks. 
In 2008 our ETF Strategies worked the best with
which had a return of +33% versus the S&P 500 which was down -38.5% for the year.
Meanwhile our 401K Strategy finished up +17.3% for
the year.
Signup for a "Free 4 Week Trial Membership" or save
up to 50% on a Premium Membership and you will have access to these Investment
Products which include the following:
1. "ETF Daily Buy and Short Signals" which can be used to trade the
DIA's, QQQQ's, SPY's and OIH's. Our ETF
Strategy returned 33% in 2008.
2. "401K/Thrift Savings Plan (TSP) Timing Service" which can be
used to help improve your return in your 401k/TSP Account which was up +17.3% in
2008.
3. The "End of Month Strategy"
finished up +36.3% in 2008. This Strategy focuses on the typical End of
Month markup by the Institutional Money.
4. "Stocks to Buy List" which can be used with either our Short
Term Strategy or Long Term Strategy. In 2007 our Long Term Strategy
finished even for the year versus the S&P 500 which was down -38.5%.
Our Winter Membership Special for
new Members is shown below
which are 50% Off our normal Monthly Rate of $39.95
|
Membership Plans
|
Initial 50% Off
Introductory Rate
|
|
30 Day Trial Membership
|
FREE |
| Monthly Membership |
$19.95 |
| 6 Month Membership |
$119.95 |
All Trial and Regular
Memberships are on a renewal basis so please email
us to cancel your Membership before it
renews as they "aren't refundable".
After the Introductory Period expires Memberships
will automatically renew at our normal Monthly Discounted Rate of $21.95.
Send this Free Newsletter to a Friend or Relative
Amateur Investors
|


