|
Weekend Stock Market Analysis
(6/3/06)
We continue to see a bounce from oversold conditions however it
has been pretty choppy over the past week or so. The Dow has rallied a
little over 230 points since making a short term bottom just over a week ago and
is currently just above its 50 Day EMA (blue line). If the Dow continues
higher early next week look for possible resistance to occur where it stalled
out at in early March just below 10350 (point A). Meanwhile if the Dow
stalls out near its 50 Day EMA and then comes under more selling pressure look
for support at the 11040 level. If the Dow was unable to hold support
around the 11040 level then its next area of support would be at its 200 Day EMA
(green line) near 10950.  Meanwhile looking at longer term
chart of the Dow shows that it has remained above its 40 Weekly EMA (blue line)
since October of 2005. The key support level to watch in the weeks ahead
is in the 10920 to 10950 range which corresponds to its longer term 38.2%
Retracement Level (calculated from the October 2004 low to the most recent high)
and 40 Weekly EMA (blue line). If the Dow were to break below the 10920
level in the longer term then its next area of support would be at its 50%
Retracement Level near 9700 (point B). 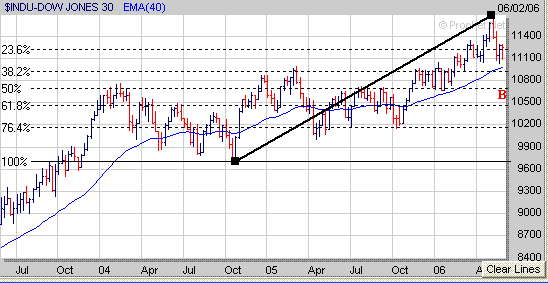
The Nasdaq has rallied just over 100
points since making a short term bottom seven trading days ago and has risen
back to its 200 Day EMA (green line) near 2230. At this point one of two
things may occur with the Nasdaq in the short term. The first scenario
would be for the Nasdaq to rise above its 200 Day EMA leading to a move up to
its 50 Day EMA (blue line) near 2260 which is its next level of resistance above
2230. Meanwhile the second scenario would be for the Nasdaq to stall out
near its 200 Day EMA and then come under more selling pressure leading to an
eventual retest of its low made just over a week ago near 2135. 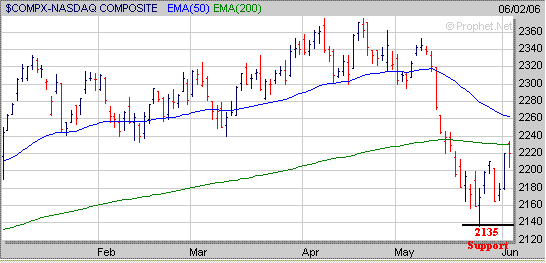
Meanwhile if we look at a longer
term chart of the Nasdaq the 2135 level is a critical support area for the
Nasdaq as it corresponds to its 38.2% Retracement Level (calculated from the
August 2004 low to its most recent high) and also is along its upward sloping
trend line (brown line) originating from the August 2004 low. If the
Nasdaq were to fall below the 2135 level then its next area of support would
either be at its 50% Retracement Level near 2060 (point C) or at its October
2005 low near 2030 (point D). Thus it will be very important for the
Nasdaq to hold support near the 2135 level in the weeks ahead to keep its longer
term upward bias intact. 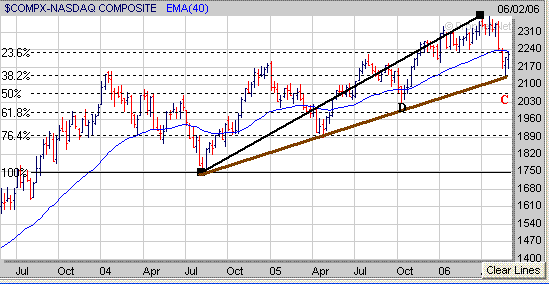
Furthermore keep an eye on the
Semiconductor sector which will continue to have an impact on the Nasdaq.
The Semiconductor Index (SOX) has been basically in a downtrend since peaking in
early January near 560. Currently the SOX has bounced off a key support
level just below 460 which coincides with its 50% Retracement Level (calculated
from the September 2004 low to the early January 2006 high) and upward sloping
trend line (brown line) that originates from the April 2005 low. If the
SOX is able to hold support near the 460 level in the weeks ahead and can
eventually rise back above its 40 Weekly EMA (blue line) near 490 then this
would likely have a positive impact on the Nasdaq. However if the SOX
breaks below the 460 support area then look for a drop back to its 61.8%
Retracement Level near 430 (point E) which would likely have a negative affect
on the Nasdaq. 
As for the S&P 500 it has
rallied around 45 points since making a short term bottom just over a week ago
near 1245 which corresponded to its 50% Retracement Level (calculated from the
October 2005 low to its most recent high). Currently the S&P 500 has
risen back to its 50 Day EMA which is just below the 1290 level and also
corresponds to its 23.6% Retracement Level as well. If the S&P 500 is
able to rise above the 1290 level early next week then look for possible
resistance to develop around the 1300 level. Meanwhile if the S&P 500
stalls out near the 1290 level and then comes under some selling pressure look
for initial support either at its 200 Day EMA (green line) which is around
1264. If the 1264 level is broken then the S&P 500 would like drop
back to its low made just over a week ago near 1245. 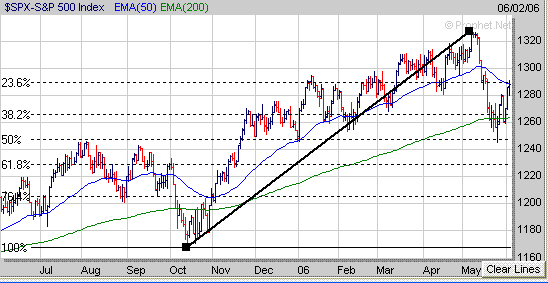
A
longer term chart of the S&P 500 still shows that it remains above its
upward sloping trend line (brown line) that originates from the low made in
August of 2004. In addition the S&P 500 has a key support level near
1230 which coincides with its upward sloping trend line and 38.2% Retracement
Level (calculated from the August 2004 low to its most recent high). As
long as the S&P 500 can hold support at or above the 1230 level then its
longer term upward bias will remain intact. 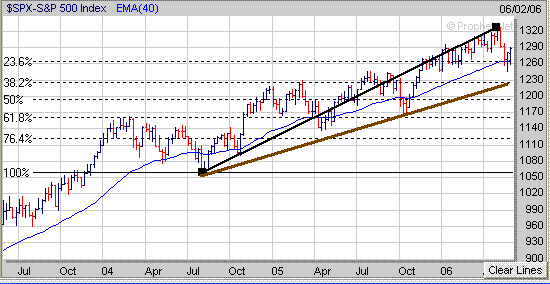
As
far as market sentiment goes the Volatility Index (VIX) continued lower this
week as the major averages continued to bounce from oversold conditions.
As mentioned last weekend the VIX has acted similarly over the past few years as
significant spikes upward (points F to G) have been followed by a rapid drop
downward (points G to H). As you can see below after each downside
reversal in the VIX (points G to H) the S&P 500 has then rallied for a
period of time ranging from just a few weeks (points I to J) up to several weeks
(points K to L). Of course the big question is will
this latest strong downside reversal in the VIX lead to a rally lasting several
weeks like occurred in the Fall of 2005 and Spring of 2005 or will it be much
shorter in duration like occurred in the Spring of 2004 (points I to
J)? 
Since no one really knows what may
happen to the market over the next several weeks you still need to keep a list
of those stocks which are holding up well and developing a favorable chart
pattern such as the Cup and Handle, Double Bottom with a Handle or a Flat Base. For
example ARXT from our current Top 100 Stocks List has formed the right side of a
6 month Cup. Now what I would like to see is for ARXT to start developing
a constructive Handle over the next 2 to 3 weeks to complete a favorable
"Cup and Handle" pattern. 
Keep in mind stocks breaking out of
a favorable chart pattern such as the "Cup and Handle" can eventually
make significant moves upward. For example ARD formed a 6 month Cup
followed by a 4 week Handle (H) in 2005 and then broke out in the Fall
accompanied by an increase in volume. Over the next 5 months ARD then rose
from $16 to $36 for a gain of 125%.. 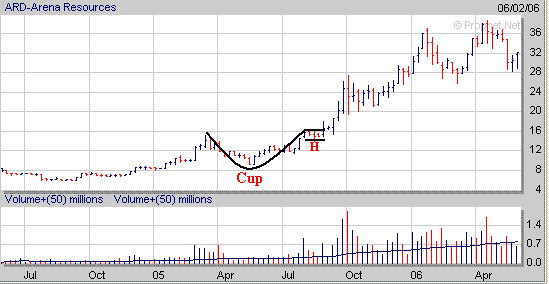
Signup today for a "Free"
2 Week Trial Membership to Amateur Investors and have access to
all of the Stocks in our current Stocks to Watch Buy List which contains stocks that are currently developing a favorable chart
pattern such as the Cup and Handle, Double Bottom and Flat Base which can be used with either our Long Term
Investing Strategy or Short Term Investing
Strategy.
Also you will have access to these other investment products.
Daily Breakout Reports
Market Timing Indicator
Daily ETF Buy and Short Signals
Click
Here to Signup for a "Free" 2 Week Trial Membership
Send this Free Newsletter to a Friend or Relative
Amateur Investors
|


