|
(3/10/07)
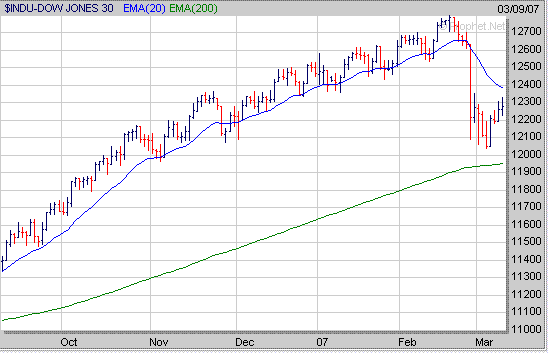
We got an expected oversold bounce this week after the big
downward move the previous week. The Dow has rallied nearly 300
points after making a low near 12040 on Monday. If the Dow continues to
bounce from oversold conditions early next week look for resistance to come in
near its 20 Day EMA (blue line) which is just below the 12400 level.
Meanwhile if the Dow stalls out next week and then begins to sell off again I
expect it will then eventually drop back to its 200 Day EMA (green line) near
11950 which is a key support level. 
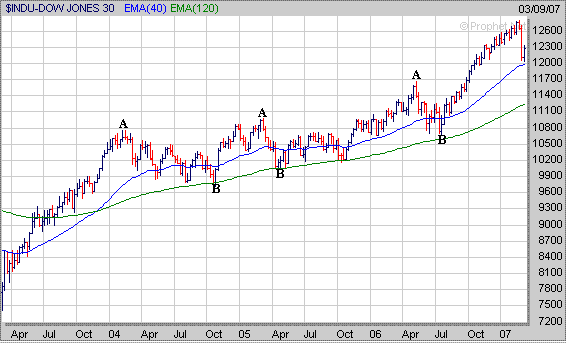
A
longer term weekly chart of the Dow shows that each time it has gone through a
major correction since 2004 (points A to B) it has failed to hold support at its
40 Weekly EMA (blue line) and eventually dropped back close to its 120 Weekly
EMA (green line). Thus if the Dow does fail to hold support at its 40
Weekly EMA then that could lead to an eventual drop back to its 120 Weekly EMA
near 11250 at some point. 
The Nasdaq bounced off its 200 Day EMA (green line) on Monday
and then rallied back up to just above the 2400 level on Friday. If the
Nasdaq attempts to move a little higher next week look for resistance to occur
at its 20 Day EMA (blue line) near 2425. Meanwhile if the Nasdaq stalls
out next week and then comes under more selling pressure look for initial
support at its 200 Day EMA near 2340. 
A
longer term weekly chart of the Nasdaq shows it hasn't been able to hold support
at its 40 weekly EMA (blue line) either during each major correction since 2004
(points C to D). In fact the last 3 major corrections in the Nasdaq have
ranged from -14% to -19% before a bottom occurred (points D). If we see
another 15% correction in the Nasdaq that would take it down to around the 2150
area before a potential bottom occurs. 
As far as the S&P 500 it made a low near 1374 on Monday
and rallied back up to near 1407 on Friday. If the S&P 500 rises a few
more points look for resistance to occur at its 20 Day EMA (blue line) near
1416. Meanwhile if the S&P 500 stalls out next week and then comes
under more selling pressure that may eventually lead to a drop back to its 200
Day EMA (green line) near 1366. 
A
longer term weekly chart of the S&P 500 also shows that it hasn't been able
to hold support at its 40 Weekly EMA either each time it has gone through a
sustained correction since 2004 (points E to F) as support has come in near its
80 Weekly EMA (green line). Thus it will be important for the S&P 500
to hold support at its 40 Weekly EMA in the coming weeks as a break below it
would likely lead to a drop back to its 80 Weekly EMA near
1320. 
Finally one thing we need to watch closely is the Volatility
Index (VIX) which dropped substantially this week (points G to H) as the market
bounced from oversold conditions. This pattern looks very similar to what
occurred in the spring of 2006 when the VIX rose substantially (points I to J)
as the S&P 500 sold off (points K to L) but then quickly reversed to the
downside (points J to M) as the S&P 500 bounced from oversold conditions
(points L to N). Meanwhile also notice that the big drop in the VIX was
then followed by another substantial move higher (points M to O) which coincided
with another move lower in the S&P 500 (points N to P). Thus don't be
surprised if we see the same type of action occur in the S&P 500 with
another significant move lower before the end of the month. 
Over the next several weeks I expect the market will remain
rather volatile with your best opportunities coming from the major ETF's rather
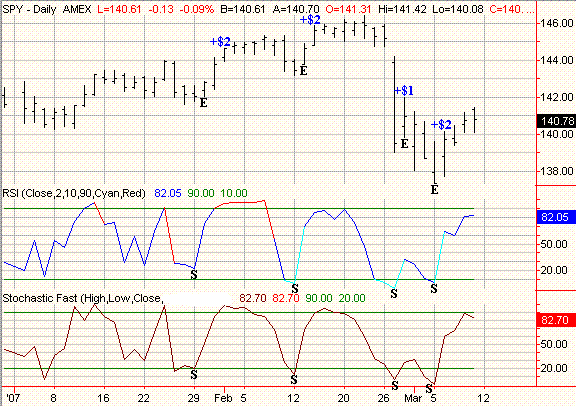
than individual stocks. One signal I look for in my Daily ETF Strategy is
when the Relative Strength Index (RSI) closes below 50 for 3 days in a row and
the Fast Stochastic drops to 20 or below indicating the market has become
oversold. During the past six weeks 4 of these signals (points S)
have occurred with the SPY's gaining $1 to $2 from the entry price (points E)
within 1 to 3 trading days. 
For those interested in our Premium Membership Services which
includes our Daily ETF Signals you can signup for a Free 30 Day Trial
Membership. In 2006 as shown below all of our Strategies pretty much doubled that of the
major averages. Click
Here to Signup for a "Free" 4 Week Trial Membership to Amateur Investors
Amateur
Investors (AI) Performance vs the Major Averages
| Year |
2006 |
|
AI Long Term Strategy
|
+30.0% |
|
AI Short Term Strategy
|
+32.5% |
| AI ETF Daily Strategy |
+46.0% |
| Dow |
+16.3% |
| Nasdaq |
+9.5% |
| S&P 500 |
+13.6% |
Send this Free Newsletter to a Friend or Relative
Amateur Investors
|


