|
(10/17/09)
The major averages are approaching longer term resistance areas
as they trace out an ABC corrective rally from the March lows. The
Dow's next significant area of resistance is near 10300 (blue line)
which is the 50% Retrace calculated from the October 2007 high to the March 2009
low. 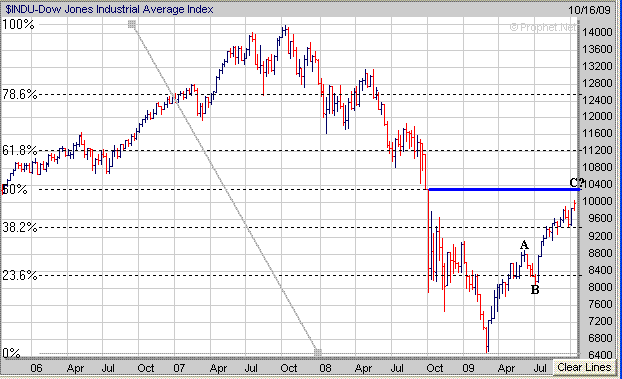
The Nasdaq's next
area of long term resistance is at the 61.8% Retrace near 2250 (blue line)
calculated from the October 2007 high to the March 2009. 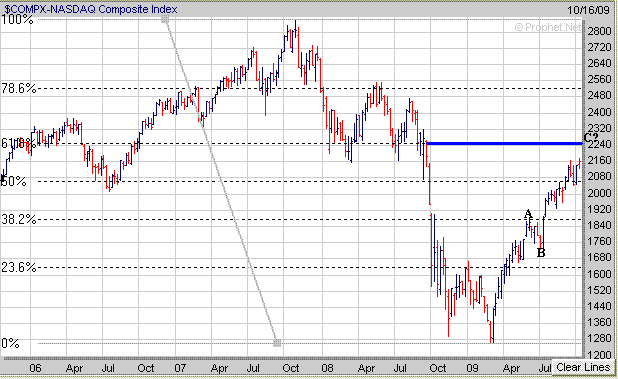
Meanwhile the
Nasdaq 100 is already approaching it's 61.8% Retrace near 1772 (blue line)
calculated from the October 2007 high to the November 2008 low. 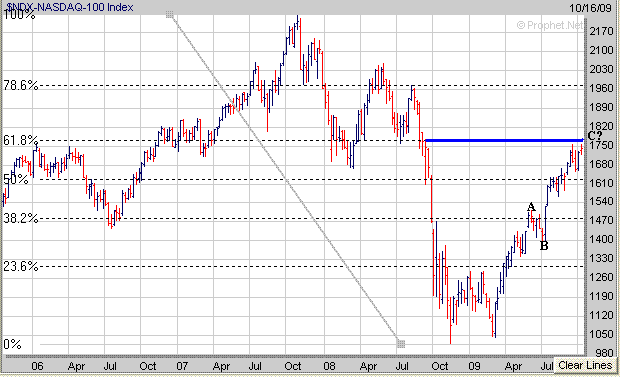
Finally the
S&P 500's next area of longer term resistance is at the 50% Retrace of 1121 (blue line) calculated from the
October 2007 high to the March 2009 low. In addition also notice its
downward trend line (black line) from the October 2007 high also comes into play near the 1121 area as
well. 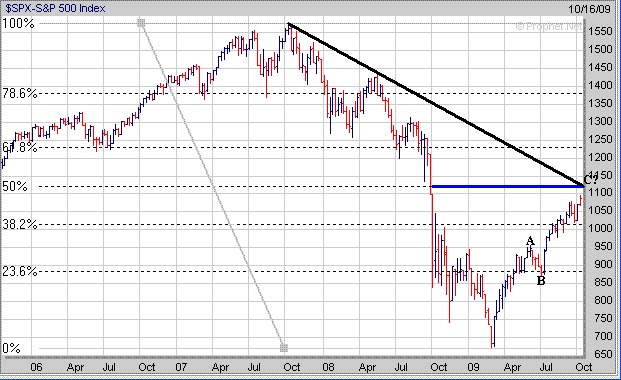
Once again many are
saying the Bear Market is done and the next Bull Market has begun.
However based on historical data by Robert Shiller the PE Ratio for the S&P
Composite has not reached a level where previous Secular Bear Market bottoms
have occurred. In the chart below historically the PE Ratio has dropped to
7.0 or below (points D) before a Secular Bear Market bottom has
developed. This was the case in the early 1920's, early 1930's and
in the early 1980's. So far the lowest PE Ratio, in this current
Secular Bear Market, based on Shiller's data has been just above the 13.0 level
(point E). As I pointed out last week previous Secular Bear Markets have
been elongated affairs that have lasted anywhere from 15 to 20 years. Also the overall
pattern so far resembles the 1906-1921 and 1966-1982 Secular Bear Markets versus
the 1930-1949 time period which formed a large "ABCDE" Triangle
pattern before breaking out in the early 1950's. 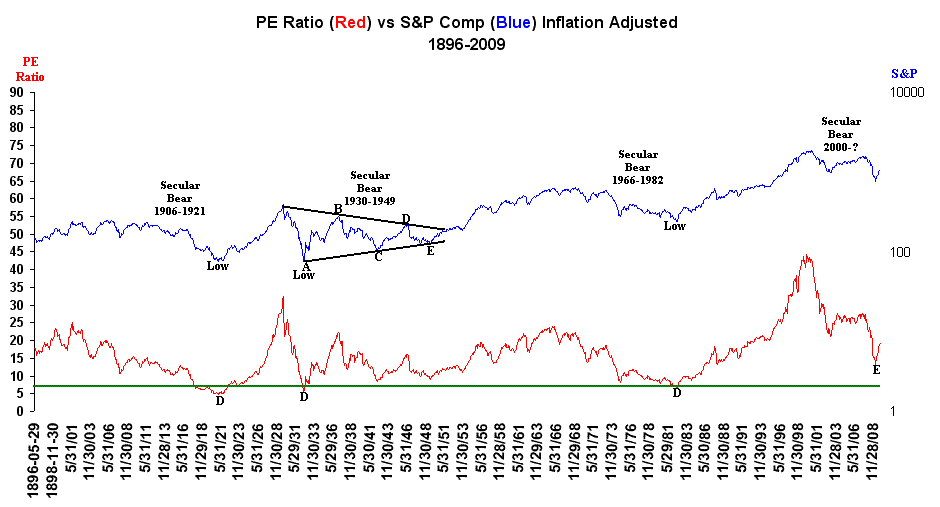
The rally from the March low has been impressive however as
pointed out above it's no different than what has occurred in previous Secular
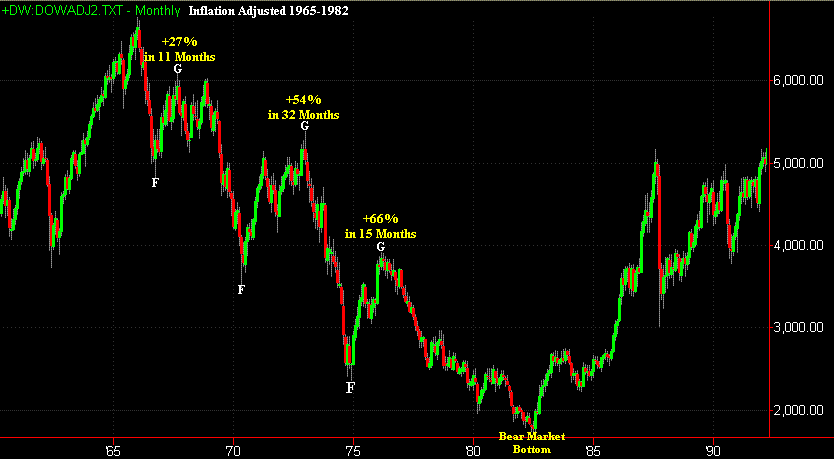
Bear Markets. The chart below is the Dow Adjusted for Inflation for
the period from 1965 through the early 1980's. Notice there were
"3" sharp oversold rallies (points F to G) that lasted from 11 to 32
months however the overall trend remained downward until the bottom occurred in
1982.
Signup for a "Free 4 Week Trial Membership" or save
up to 50% on a Premium Membership and you will have access to the following
products.
1. "ETF Daily Buy and Short Signals"
which can be used to trade the DIA's, QQQQ's and SPY's.
2. "401K/Thrift Savings Plan (TSP) Timing
Service" which can be used to help improve your return in your 401k/TSP
Account.
3. The "End of Month Strategy".
This Strategy focuses on the typical End of Month markup by the Institutional
Money.
4. "Stocks to Buy List" which can be
used with either our Short Term Strategy or Long Term Strategy.
Our Fall Membership Special for
new Members is shown below
which are 50% Off our normal Monthly Rate of $39.95
|
Membership Plans
|
Initial 50% Off
Introductory Rate
|
|
30 Day Trial Membership
|
FREE |
| Monthly Membership |
$19.95 |
| 6 Month Membership |
$119.95 |
All Trial and Regular
Memberships are on a renewal basis so please email
us to cancel your Membership before it
renews as they "aren't refundable".
After the Introductory Period expires Memberships
will automatically renew at our normal Monthly Discounted Rate of $21.95.
Send this Free Newsletter to a Friend or Relative
Amateur Investors
|


