Example #2

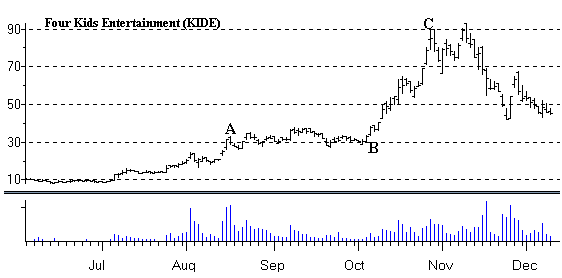
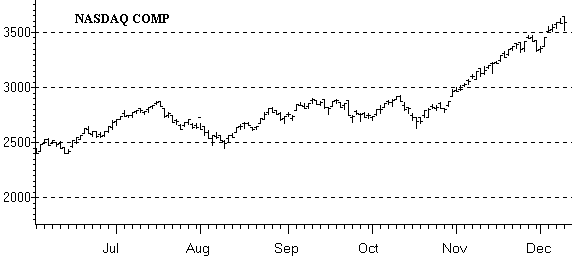
Back around the 1st of July KIDE was trading around $10 a share and rose to around $30 by mid-August (Point A). During the next 6 weeks it formed a base (Points A to B) and then exploded from $30 to $90 during the month of October (points B to C). Comparing KIDE to the NASDAQ chart shows it moved sideways with the NASDAQ from mid-August to mid-October. KIDE then broke out to new highs when the NASDAQ reestablished its up trend in late October. .

KIDE also had a 2 for 1 split in mid-September so actually the stock rose from $20 to $180 a share in roughly 4 months. Thus the stock appreciated nearly 800% in 4 months. Looking at a table of the Sales, Earnings and Net Profit Margins will show similar characteristics to EMLX.
| KIDE | 4Q 98/97 | 1Q 99/98 | 2Q 99/98 | 3Q 99/98 |
| SALES | +5% | +35% | +150% | +509% |
| EARNINGS | -14% | +133% | +1500% | +1250% |
| MARGINS | 25.7% | 21.2% | 34.5% | 40.5% |
Once again rapidly increasing Sales and Earnings along with Net Profit Margins made this stock stand out from other stocks. In addition KIDE was in a Strong Industry Group which had a Relative Strength of 90. Furthermore KIDE had only 11 million shares outstanding and Institutional Ownership was around 9%, back in July, before the stock started to move. As you can see both EMLX and KIDE show very similar characteristics. I can't stress more the importance of adhering to strict guidelines when looking for stocks that may eventually produce significant price appreciation..
Now lets take a look at an example where a company has Sales and Earnings that are decelerating.