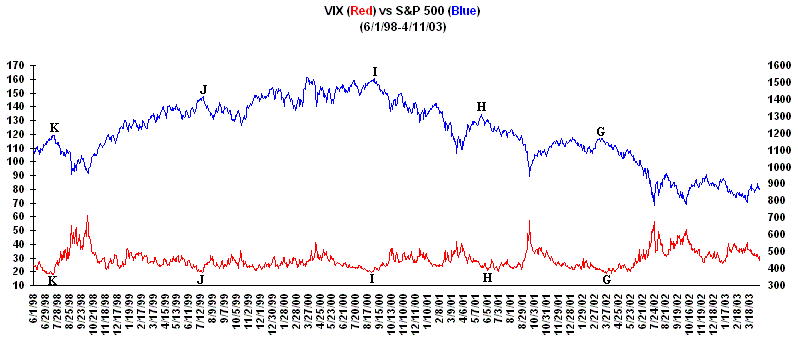
The last index we will look at is the Volatility Index (VIX). The VIX measures fear and optimism as measured by OEX options activity. When large numbers of traders become fearful, the VIX reading rises, and when complacency develops, the VIX reading falls. Since the majority of put/call buyers are usually wrong it's usually a good contrarian indicator. When the VIX exhibits high readings it means the market is becoming oversold (excess of bearishness) and when there are low VIX readings the market is becoming overbought (excess of bullishness). So when the VIX is at extremes it usually gives a good signal of an impending short term bottom or top depending on the current market environment.
In the chart below notice the strong upward spikes in the VIX and how they
corresponded to a bottom followed by a significant reversal to the upside in the
S&P 500. Some of the more notable upside reversals occurred in the
Fall of 2002 (point A), Summer of 2002 (point B), Fall of 2001 (point C), Spring
of 2001 (point D), Fall of 1999 (point E) and back in the Fall of 1998 (point
F). As you can see when the VIX has risen above a reading of
"50" this has provided a very strong signal of a nearing bottom over
the past several years.
Meanwhile when the VIX is exhibiting a very low value generally in the lower
20's or below this can signal a nearing top followed by a significant sell
off. Some examples include the Spring of 2002 (point G), Summer of 2001
(point H), Summer of 2000 (point I), Summer of 1999 (point J) and Summer of 1998
(point K).

Although all three of the indicators (Put to Call Ratio, Bullish-Bearish Sediment and Volatility Index) aren't always perfect they do provide some valuable insight to when a change in the markets is forthcoming and if used properly may help investors with their investment decisions.
|


