amateur-investor.net
Market Timing Indicator
Our Market Timing Indicator (MTI) is based on Bollinger Bands,
the Commodity Channel Index and Slow Stochastics. The MTI looks for
reversals when the market has become overbought or oversold.
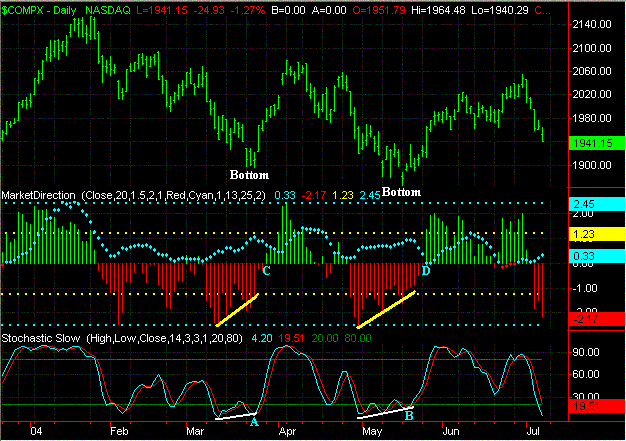
The key things I look for when the market is getting
close to reversing to the upside after getting oversold are the following.
1. The %K Line (light blue line) in association
with the Slow Stochastics drops below 20 and then begins to show an upward
sloping bias as shown by the solid white lines.
2. The Selling Pressure begins to decrease as the market becomes
oversold (depth of the solid red bars begins to decrease as shown by the upward
sloping yellow lines.)
3. Next I look for the %K Line (light blue line) to cross above the
%D Line (solid red line) in association with the Slow Stochastics as shown by points A and B below.
4. Then I look for a change in color from the Red
Bars to a Green Bar as shown by points
C and D which is an indication of developing Buying Pressure.

As you can see above when all four of these conditions were
met the Nasdaq made a bottom in mid March and again in mid May of
2004. After making a bottom in mid March the Nasdaq then rose from
1900 to 2080 for a gain of 180 points over the next two weeks. Meanwhile
after making a bottom in mid May the Nasdaq rose from 1880 to around 2060 for
another gain of 180 points during the next six weeks.
Meanwhile when the market is getting overbought and is nearing
a downside reversal these are the conditions I look for.
1. The %K Line (light blue line) in association
with the Slow Stochastics rises above 90.
2. The Buying Pressure begins to decrease as the market becomes
overbought (depth of the solid green bars begins to decrease as shown by
the downward sloping yellow lines.)
3. Next I look for the %K Line (light blue line) to cross below the
%D Line (solid red line) and drop below 80 as shown by points D and E below.
4. Then I look for a change in color from a Green
Bar to a Red Bar
as shown by points F and G.
As you can see above once all four of these conditions were
met the Nasdaq made a top in mid January and again in early April
of 2004. After making a top in mid January the Nasdaq then dropped
from 2150 to 1900 for a loss of 250 points over the next two months. Meanwhile
after making a top in early April the Nasdaq dropped from 2080 to around 1880
for a loss of 200 points during the next six weeks.
How can you make use of our Market Timing Indicator (MTI) as
an investor?
1. You can use our MTI system to anticipate when to buy individual
stocks or ETF's as the market gets oversold and approaches an upside reversal.
2. You can use our MTI system to anticipate when to sell individual
stocks or ETF's as the market gets overbought and approaches a downside
reversal.
3. You can also use our system to short individual stocks or ETF's as
the market tops out and begins to reverse to the downside.
4. For those in 401K Plans or a government backed Thrift Savings Plan
(TSP) you can use our MDI system to adjust your 401K Portfolio's or TSP
accounts as the market becomes overbought or oversold.
|


