|
(1/24/09)
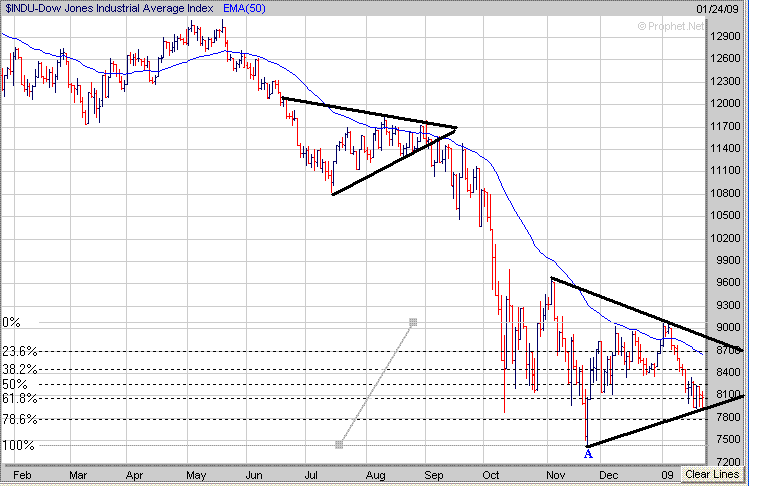
It was very choppy this week with wild swings in both
directions. Overall the Dow dropped below its 61.8% Retracement
Level (calculated from the 11/21 low to the 1/6 high) near 8075 but remained
above its last level of major support at the 78.6% Level near 7800.
It appears the Dow is developing a Triangle pattern (black lines) much like
occurred last Summer. If the Dow attempts to make one more move to
the upside next week I would look for resistance at the top of the Triangle
pattern near 8700 which is also very close to its 50 Day EMA (blue line) as
well. Meanwhile if the Dow fails to rally next week and it
drops below 7800 then look for a retest of the 11/21 low near 7450 (point
A).

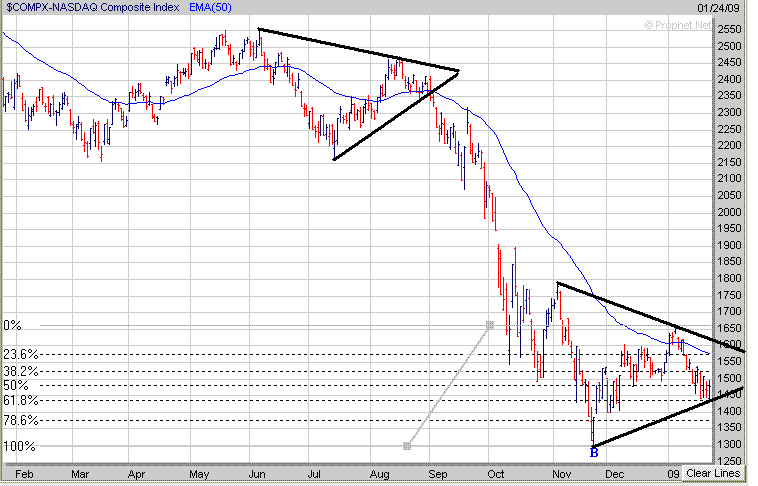
As far as the
Nasdaq it held support this week at its 61.8% Retracement Level near 1438
(calculated from the 11/21 low to the Jan 6th high). Just like
the Dow it appears to be developing a Triangle pattern as well. If the
Nasdaq makes one more move to the upside next week look for resistance to occur
at the top of the Triangle near 1575 which is also near its 50 Day EMA (blue
line). Meanwhile if the Nasdaq doesn't rally next week and
drops below the 1438 level then that may lead to a retest of the 11/21 low near
1300 (point B). 
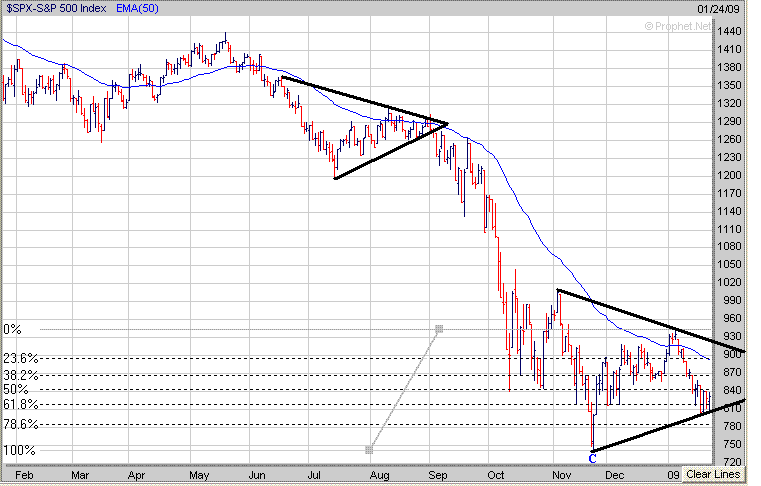
The S&P 500
dropped below its 61.8% Retracement Level (calculated from the 11/21 low to the
1/6 high) near 818 this week but held support above its 78.6% Retracement Level
at 784. If the S&P 500 rallies next week look for resistance to
occur at the top of its Triangle near 900 which is close to its 50 Day EMA (blue
line) as well. Meanwhile if the S&P 500 breaks below the 784 level
then look for a retest of the 11/21 low at 741 (point C). 
In 2008 our ETF Strategies worked the best with
which had a return of +33% versus the S&P 500 which was down -38.5% for the year.
Meanwhile our 401K Strategy finished up +17.3% for
the year.
Signup for a "Free 4 Week Trial Membership" or save
up to 50% on a Premium Membership and you will have access to these Investment
Products which include the following:
1. "ETF Daily Buy and Short Signals" which can be used to trade the
DIA's, QQQQ's, SPY's and OIH's. Our ETF
Strategy returned 33% in 2008.
2. "401K/Thrift Savings Plan (TSP) Timing Service" which can be
used to help improve your return in your 401k/TSP Account which was up +17.3% in
2008.
3. The "End of Month Strategy"
finished up +36.3% in 2008. This Strategy focuses on the typical End of
Month markup by the Institutional Money.
4. "Stocks to Buy List" which can be used with either our Short
Term Strategy or Long Term Strategy. In 2007 our Long Term Strategy
finished even for the year versus the S&P 500 which was down -38.5%.
Our Winter Membership Special for
new Members is shown below
which are 50% Off our normal Monthly Rate of $39.95
|
Membership Plans
|
Initial 50% Off
Introductory Rate
|
|
30 Day Trial Membership
|
FREE |
| Monthly Membership |
$19.95 |
| 6 Month Membership |
$119.95 |
All Trial and Regular
Memberships are on a renewal basis so please email
us Amateur-Investors@amateur-investors.com to cancel your Membership before it
renews as they "aren't refundable".
After the Introductory Period expires Memberships
will automatically renew at our normal Monthly Discounted Rate of $21.95.
Send this Free Newsletter to a Friend or Relative
Amateur Investors
|


