The Mutual Fund Panic Index
Based on data reported by the Federal Reserve Flow of Funds Reports, which have been released on a Quarterly basis since 1952 I have formulated an Index based on flows involving Mutual Funds which I call the Mutual Fund Panic Index.
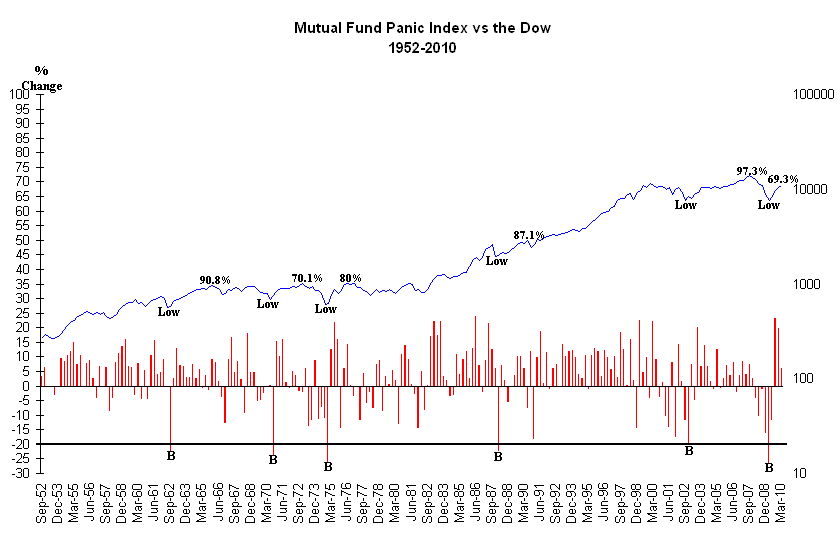
Basically what the Mutual Fund Panic Index shows is that when the total value of Equities held by Mutual Funds decreases by 20% (as denoted by black line) on a Quarterly basis significant Market Bottoms have occurred since the early 1950's as the chart below shows.

Meanwhile the table below shows all of the Quarterly Signal dates since 1952 along with the total gain in the Dow from the Low to the High and the number of Quarters it took for the High to be reached.
As you can see Total Gains have ranged from 70.2% up to 97.3% when a Signal has occurred. The last Signal occurred in the 4th Quarter of 2008 which was followed by the bottom in March of 2009.
Also keep in mind the Flow of Funds data is released by the Federal Reserve roughly 2 1/2 months after the actual Quarter Ends so this last Signal matched up very well with the actual bottom.
Meanwhile also notice I have included the performance over the 1st 4 Quarters when a Signal has occurred. Overall when a Signal has occurred the gain over the 1st 4 Quarters prior to the last Signal has ranged from 35.8% to 55.9% in the Dow. However notice the current Signal has been followed by a gain of 69.3% over the past 4 Quarters. This is by far the largest gain over a 4 Quarter period since a Signal has occurred which has happened only 6 times since the early 1950's.
| Quarter |
Low |
High |
Total |
1st
4 |
Total |
| Signal
Date |
|
|
Gain |
Quarters |
Quarters |
| 2Q
1962 |
524.6 |
1001.1 |
90.8 |
39.7 |
15 |
| 2Q
1970 |
627.5 |
1067.7 |
70.2 |
52.7 |
11 |
| 3Q
1974 |
570 |
1026.3 |
80.1 |
55.9 |
8 |
| 4Q
1987 |
1616.2 |
3024.3 |
87.1 |
35.8 |
11 |
| 3Q
2002 |
7197.49 |
14198.09 |
97.3 |
45.4 |
21 |
| 4Q
2008 |
6469.75 |
10955.48 |
69.3 |
69.3 |
4
so far |
Signup today for a Premium Membership and access to our Mutual
Fund Panic Index, Stocks
to Watch Buy List which provides a list of Stocks that are exhibiting favorable Chart Patterns
along with specific Buy and Stop Loss Prices in addition to Target
Prices. In addition you will have access to our Daily
ETF Signals, 401K/TSP Signals
and Market
Timing Indicator (MTI) as well. For those that like to Short we also a maintain a
small list of ETF's to short as well.
Also you will receive our Daily Breakout Report
by email which Alerts you to Stocks
that are breaking out of a favorable Chart Pattern from our Stocks
to Watch List.
Our Spring Membership Special for
new Members is shown below
which are 50% Off our normal Monthly Rate of $39.95
|
Membership Plans
|
Initial 50% Off
Introductory Rate
|
|
30 Day Trial Membership
|
FREE |
| Monthly Membership |
$19.95 |
| 6 Month Membership |
$119.95 |
All Trial and Regular
Memberships are on a renewal basis so please email
us to cancel your Membership before it
renews as they "aren't refundable".
After the Introductory Period expires Memberships
will automatically renew at our normal Monthly Discounted Rate of $21.95.
By becoming a Member of Amateur-Investors.Com you acknowledge
that you have read the Billing
Policy, Disclaimer
and Terms
of Use Policy and agree to these terms.
|


